
TSIGARIS – Analysing the shocking numbers on Kamloops unemployment

By Dr. PETER TSIGARIS
Thompson Rivers University
THE LATEST Statistics Canada numbers delivered a shock to Kamloops: our unemployment rate spiked to 10.7% in July 2025, almost double the 5.6% a year earlier.

Dr. Peter Tsigaris.
At the same time, the participation rate surged to 71%, the highest in Canada, and the labour force grew by 17%. Such swings are rare for a region of our size. Labour force statistics in smaller communities are noisy because the survey covers only 250–300 people each month resulting in a margin of error ±2%.
Even so, the direction is unmistakable: from 4.8% in January to 10.7% in July, unemployment has more than doubled. In a recent study, I examined neighbourhood unemployment in Kamloops over the past decade (Tsigaris, 2025). The sharp July 2025 surge now adds a new, city-wide dimension to those longer-term patterns.

Figure 1. Monthly unemployment rate in Kamloops, January–July 2025, with 95% confidence intervals. Each estimate is based on a survey sample of roughly 250–300 people, resulting in margins of error of about ±2 percentage points. Month-to-month changes between May and July are within the margin of error, so we cannot say with confidence that unemployment rose in that short period. The broader trend, however, shows unemployment more than doubling since January.
The Bathtub of unemployment
The best way to picture our situation is as a bathtub of unemployment. The water represents the unemployed, 8,300 people in July. The tap pours water whenever people lose jobs or enter the labour market. The drain lets water out when people find work or leave the labour force.
In July, the tap was running faster than the drain. Layoffs in retail and resources, along with new entrants, poured water in. The drain was working too, construction and mining have been adding jobs, but it was also partly clogged. Uncertainty created by Trump’s tariffs and the trade war has slowed job creation, making employers more cautious about hiring.
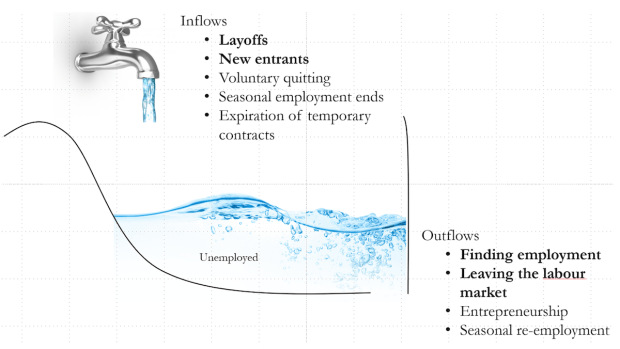
Figure 2. The bathtub of the unemployed people
Supply Shock, Demand Lag
The surge of new entrants reflects a major inflow into the bathtub: international students at TRU often seek part-time work while studying and later full-time jobs under the Post-Graduation Work Permit; domestic TRU students also look for part-time work or full-time employment after graduation; high school youth turning 15 are newly counted in the labour force; and migrants or returning workers re-enter the job market.
At the same time, labour demand has lagged. Even though construction and mining have added jobs, broader hiring has slowed. Uncertainty linked to Trump’s tariffs and trade disputes has made firms cautious about expanding, especially in resource and export-oriented industries. The result is that employment gains, while real, have not been strong enough to absorb the flood of new job seekers.
Why the Labour Force Grew So Fast
Earlier this year, Statistics Canada revised the Labour Force Survey by reclassifying Kamloops from a Census Agglomeration to a Census Metropolitan Area and by improving its counts of non-permanent residents, mostly international students. These revisions apply retroactively back to 2011, so they do not explain the sudden 17% surge in the labour force between July 2024 and July 2025. The real driver is the inflow of new entrants. International students have the largest share, but migrants, high school youth, and domestic TRU graduates also expanded the labour force. Many are initially unemployed, raising both participation and unemployment during transition.
Kamloops vs. Kelowna, July 2025
The contrast with Kelowna highlights how unusual Kamloops’ situation is. Kamloops added far more jobs than Kelowna, but its surge of new entrants (+17% labour force vs. +0.3% in Kelowna) pushed unemployment sharply higher. At the same time, Kamloops’ participation rate of 71.2% is the highest in Canada, showing just how many residents are actively in the labour market. By contrast, Kelowna’s rate of 58.2% is among the lowest. From the supply side, Kamloops is one of the hottest labour markets in the country, but the demand side has not kept pace.
Table 1. Labour Market Indicators, July 2024 – July 2025
| Indicator | Kamloops | Kelowna |
| Unemployment Rate | 10.7% (↑ 5.1) | 4.7% (–0.1 pts) |
| Participation Rate | 71.2% (↑ 4.7 pts)
highest in Canada |
58.2% (–1.3 pts)
among lowest |
| Employment Growth | +10.8% | +0.3% |
Student Spending and Labour Market Pressure
Many of the students at TRU relocate from outside the region or abroad, and their presence has a significant local economic impact. According to an economic impact study, TRU student spending on rent, groceries, transportation, and other necessities added $73.2 million to the Thompson Rivers region, of which $39.5 million came from international students (Lightcast, 2024).
Table 2. Annual Economic Impact of TRU Student Spending, 2023–24
| Category | All Students | International Students |
| Total Spending Impact | $73.2 million | $39.5 million |
| Share of Total | 100% | 54% |
This money sustains local businesses, landlords, and service providers, and much of it would vanish without TRU attracting these students. Yet the same influx also raises the labour force.
Looking Ahead
Governments have offered loan guarantees for lumber and accelerated housing construction but retraining and job-matching remain crucial. Canada is also redirecting exports to China, Mexico, and Europe as U.S. demand weakens under tariffs. If tariffs persist and student inflows slow, Kamloops faces a difficult adjustment. The city’s challenge is not only creating jobs but also balancing the economic benefits of international students with the labour pressures they generate.
Some of the consequences are clear:
- International student enrolment: fewer arrivals will lower the participation rate, offering labour market relief, but will also cut local spending by up to $20 million annually.
- External shocks: tariffs risk weakening exports and local demand.
- Cost of living: higher prices push households to add earners, swelling labour supply.
- Structural mismatch: laid-off retail and resource workers cannot easily shift into construction without retraining.
- Youth outmigration: if jobs remain scarce, more will leave for Kelowna, Vancouver, or Alberta, draining human capital.
The bottom line: Kamloops’ unemployment surge reflects also a supply shock and not an economic collapse. Employment is still rising, but the labour force has grown faster. TRU’s international students are not a burden but a major economic driver. The real challenge is coping with the scale of population inflow during these uncertain times. I also spoke about these dynamics in a CBC interview on Daybreak Kamloops (Tsigaris, 2025).
Dr. Peter Tsigaris is a Professor of Economics at Thompson Rivers University.
References:
Lightcast. (2024). Regional economic value of Thompson Rivers University to British Columbia: Fact sheet FY 2023–24. Thompson Rivers University. https://www.tru.ca/__shared/assets/fact-sheet-regional-economic-value-of-thompson-rivers-university-to-british-columbia60403.pdf
Statistics Canada. (2025, August 8). Labour market indicators, census metropolitan areas, census agglomerations and self-contained labour areas: Interactive dashboard [Data visualization product, issue no. 2024025]. https://www150.statcan.gc.ca/n1/pub/71-607-x/71-607-x2024025-eng.htm
Tsigaris, P. (2025). Understanding Kamloops neighbourhood unemployment rates. In In the shadow of the hills: Socioeconomic struggles in Kamloops (Chap. 10). Thompson Rivers University. https://shadowofthehills.pressbooks.tru.ca/chapter/understanding-kamloops-neighbourhood-unemployment-rates/
Tsigaris, P. (2025, August 21 2025). Why unemployment is rising in Kamloops [Radio interview]. In S. Joyce (Host), Daybreak Kamloops. CBC Radio. https://www.cbc.ca/listen/live-radio/1-108-daybreak-kamloops/clip/16164969-why-unemployment-rising-kamloops

Dr Tsigaris thank you for this article. Kamloops’ unemployment rate surged to 10.7% in July 2025, doubling from 5.6% a year earlier, driven by a 17% labor force increase due to an influx of international and domestic students, youth, and migrants, outpacing job creation. The city’s economy, heavily reliant on resources, retail, and public services (e.g., TRU), lacks diversification, making it vulnerable to boom-bust cycles.
Historical outsourcing of manufacturing and industrial jobs, including over 80 lumber mill closures (75 under the Liberals), has eroded Kamloops’ industrial base, limiting stable job opportunities. This structural weakness, coupled with static entrepreneurship and failure to modernize industries, constrains production capacity, exacerbating unemployment during labor supply shocks.
Overexploitation of resources like timber, profit outflows from foreign-owned industries, and high local incomes attracting more jobseekers further strain the economy. In contrast, Kelowna’s diversified economy (tourism, tech, agriculture) and lower participation rate (58.2% vs. Kamloops’ 71.2%) maintain a lower unemployment rate (4.7%) despite national job losses of 41,000. Kamloops’ lower cost of living draws workers, but limited jobs lead to unemployment spikes.
High-wage administrative roles in Kamloops, particularly in the non-union public sector, divert resources from front-line job creation, playing a secondary role in economic pressures. In Kamloops, administrative positions like office administrators ($23–$40.87/hour) and administrative service managers ($28.85–$96.15/hour) earn above-average wages, with public sector entities like the City of Kamloops paying administrators up to $40.93/hour.
This high wage structure, coupled with a top-heavy administrative presence, diverts resources from front-line job creation in sectors like healthcare and education, where shortages persist (e.g., 6,000 nurse vacancies). Trade uncertainty from U.S. tariffs compounds these issues, but the *“macro” problem is the lack of industrial diversity and policy failures to counter outsourcing and foreign control, about which I have written many letters. *
LikeLike
It is indeed a difficult balancing act to maintain a robust job market without causing too much labour-related inflation and awareness of the environmental implications of growth.
Ideally incentives should be focused on creating conditions for innovation and entrepreneurship.
LikeLike