
DIVIDING LINES – Neighbourhood Inequality and Unemployment in Kamloops

By PETER TSIGARIS
Thompson Rivers University
Prelude: This editorial concludes a book series I co-authored with senior undergraduate students, titled In the Shadow of the Hills: Socioeconomic Struggles in Kamloops, published by TRU Open Press.

Dr. Peter Tsigaris.
Chapter 10, authored by me, examines unemployment disparities across 24 neighbourhoods in Kamloops using census data from 2011, 2016, and 2021. Drawing on principal component analysis, the chapter explores how key socioeconomic factors, such as income, education, employment rates, and family structure, help explain why unemployment remains more persistent in some areas than others.
Understanding the Divide
Kamloops may be a mid-sized city of 100,000, but neighbourhood-level differences in unemployment, income, and education suggest deeper disparities worth exploring. From 2010 to 2020, unemployment rates ranged from just 2.6% in some neighbourhoods to as high as 19% in others. Median after-tax household incomes also varied widely, from under $24,000 to over $50,000, and in certain districts, high school non-completion rates approached 30%.
Rather than viewing these figures in isolation, I examined whether they might reflect broader patterns of socioeconomic inequality. Using principal component analysis, I constructed a composite index of neighbourhood socioeconomic status by combining key factors: income, education, employment, and family structure. The results, shown in Figure 1, indicate a strong relationship between this index and unemployment rates. Specifically, for every one-unit improvement in socioeconomic status, the unemployment rate tends to drop by about one percentage point.
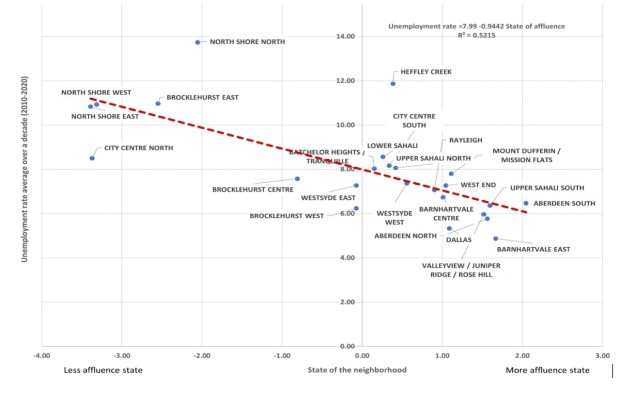
Figure 1: An association between the state of the neighbourhood and the unemployment rate in the various neighbourhoods over a decade. CC BY-NC-SA 4.0
Why Aren’t People Moving?
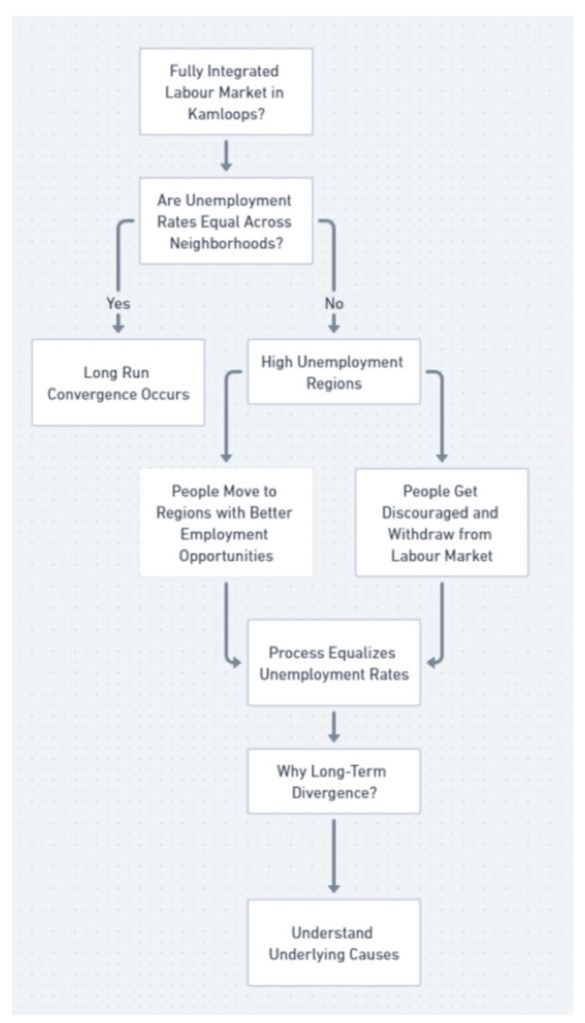
Figure 2: Convergence versus divergence of unemployment rates in the neighbourhoods of Kamloops. CC BY-NC-SA 4.0
In economic theory, perfectly integrated labour markets would tend towards convergence in unemployment rates over time (Fig 2). One of the founding hopes of the European Union, and especially the Eurozone, was that people in high-unemployment countries would move to lower-unemployment areas, where economies were stronger and growing. But in practice, that convergence has been limited. Different languages, institutions, and cultural barriers continue to slow cross-border migration and employment integration.
Even within Canada, interprovincial labour mobility faces real barriers. Labour laws, union agreements, and occupational licensing vary widely across provinces, limiting the ease with which workers can relocate. For instance, a teaching or skilled trades license valid in one province may not be recognized in another without retraining or recertification. Language laws in Quebec present further restrictions for non-francophone workers. These frictions help explain why, despite being part of a single country with a shared currency and two official languages, we still see persistent disparities in unemployment rates between provinces.
Kamloops, by contrast, faces none of these frictions. It is an integrated labour market where all 24 neighbourhoods share the same currency, language, and institutional systems. On paper, it should function seamlessly. And yet, unemployment rates are not converging here too, they are diverging and staying apart for at least a decade or longer. Why? Because even within integrated markets, other barriers persist such as lack of access to transportation, educational inequalities, and the lingering effects of income segregation within the city. These findings highlight the importance of addressing local constraints to mobility and employment, even in a city that, on paper, should be economically integrated.
The Policy Implications for Kamloops
Kamloops is often viewed as a city of opportunity, but the data tells a more complicated story. This study shows that unemployment is not evenly distributed, it clusters in neighbourhoods with lower incomes, higher high school non-completion rates, and greater numbers of single-parent households. Using principal component analysis, I found that as the socioeconomic index of a neighbourhood improves by one unit, its unemployment rate tends to drop by approximately one percentage point. This is a strong signal that local conditions matter.
The Bathtub Analogy
The bathtub model of unemployment (Fig. 3) provides a useful framework to examine policy. Inflows, such as layoffs, voluntary quitting, and new entrants including the return of previously discouraged workers, add to the unemployment “pool.” Outflows, such as successful job placements, exits from the labour force, or transitions to self-employment, help drain it.
Effective policy needs to manage both. That might involve expanding retail infrastructure or creating incentives for self-employment in underserved areas, which could generate inflows but more importantly facilitate outflows; subsidizing daycare for single parents, which increases inflows initially but enhances outflows over time; improving public transit links to job hubs, which can influence both inflows and outflows; or offering adult education and skills training programs that support outflows from the tub.
Subsidizing daycare for single parents can initially increase measured unemployment by drawing more people into the labour force, people who had previously given up looking. But over time, such policies accelerate outflows by removing barriers. Similarly, improving public transit or building new retail options can draw more people into job-seeking activity, but if successful, will lead to increased hiring and economic mobility.
Neighbourhood-focused policies can help drain that tub faster, more effectively, and more fairly. As long as well-designed interventions cause outflows into employment to rise faster than inflows into unemployment, the level in the unemployment “bathtub” will fall eventually. That’s how we may create a more inclusive and resilient economy, neighbourhood by neighbourhood.

Figure 3: The unemployment bathtub analogy CC BY-NC-SA 4.0
A Final Note
As this is the final editorial in the series, I want to thank the student researchers who contributed chapters grounded in data and guided by scientific methodology. Their work is not only academically rigorous but socially important. I also want to thank the readers and those that provided constructive comments and criticism of the series. The findings in this chapter, and throughout the book, should serve as important information for local policymakers and community leaders alike.
I invite readers to reflect on the following: How can we reduce unemployment and improve opportunity in Kamloops, by addressing the unique challenges faced in high unemployment neighbourhoods?
References:
Tsigaris, P., Awad, A., Forbes, C., Izett, P., Kadaleevanam, U., Mehta, G., Noor, S., Simms, O., & Thomson A. (2024). In the Shadow of the Hills: Socioeconomic Struggles in Kamloops. TRU Open Press. https://shadowofthehills.pressbooks.tru.ca/

I think the City should hire all unemployed people and pay them a good union wage, with benefits and a good pension. Problem solved…
LikeLiked by 1 person
When examining employment and similar metrics, we must accept that some people don’t want to work. I’m not talking about the inability to work, rather I’m talking about what is colloquially referred to as a bum. Canada is a welfare state and makes that goal reasonably achievable with minimal effort.
Complicating studies such as this is the recent phenomenon of enabling dope heads to abuse drugs and their concentration in particular neighborhoods.
Causal links between neighbourhoods and unemployment is tenuous. Neighbourhoods don’t produce bums and dope heads. Bums and dope heads suppress neighbourhoods by their presence. A neighbourhood becomes further depressed as it attracts similar riff raff, until by a stroke of luck the disinfecting hand of gentrification takes hold.
In the grand scheme of unemployment and economic prosperity, neighbourhood variance is of little consequence to the output of a country. It is far more important to ensure a strong economy at the macro level, ensuring free market principles with minimal controls where necessary, rather than trying to craft a cart-before-horse microeconomic plan that attempts to fight against the natural order of social stratification, expressed as geographical distribution of individuals by income.
Fences are popular for a reason.
LikeLiked by 1 person
There is definitely a correlation between low income/higher unemployment and lower-cost residential choices. That’s just common sense.
However, this article does not convince me that cheaper neighbourhoods in a small city like Kamloops are a contributing factor for unemployment.
To me, it’s far more likely that unemployment is a contributing factor in compelling people to move to cheaper neighbourhoods.
LikeLiked by 2 people
Thank you for your comment Bronwen and for engaging with the editorial. I’d like to clarify a few key points.
First, the title “Why Aren’t People Moving?” may have been misinterpreted as referring to housing re-allocation, but the intended meaning for Kamloops is labour mobility, specifically, why individuals in Kamloops neighbourhoods with high unemployment are not finding jobs in other neighbourhoods around the city where unemployment is lower and opportunities exist. This does not imply moving homes as would be the case for EU and Canada wide. Rather, it raises questions about why local residents remain unemployed despite geographic proximity to jobs with very low transportations costs (i.e., public transit).
Second, the editorial focuses on structural unemployment. Using census data and Principal Component Analysis (PCA), the analysis identifies clusters of socioeconomic disadvantage, such as lower income, education levels, and labour force participation, that correlate strongly with neighbourhood unemployment rates. These are long-standing patterns tied to structural barriers, not housing costs, which were not part of the data or analysis.
Third, Okun’s Law, a well-established macroeconomic relationship, shows that changes in economic conditions drive changes in unemployment, not the reverse. Unemployment is a laggard indicator, meaning it reflects earlier economic conditions. Firms first lose revenue and then lay-off workers. For instance, U.S. President Trump recently celebrated strong job creation numbers, but these figures reflect prior economic momentum. In fact, the U.S. economy contracted in the first quarter of 2025 and is expected to shrink again in Q2, making it very likely that unemployment will rise above 4.2% in the near term, despite recent celebrated job report…..
As stated above, national or EU-level labour market models often assume mobility requires regional relocation and high transportation costs, Kamloops is different. Here, distances are short, and commuting costs are very low. The real question is why residents in high-unemployment neighbourhoods aren’t accessing jobs just a few kilometres away. This points to socioeconomic, cultural, or institutional barriers, not geographic or housing-based ones.
Thanks again for the opportunity to clarify and continue this important discussion.
LikeLike