
COVID-19 – Income Inequality during the pandemic in Kamloops
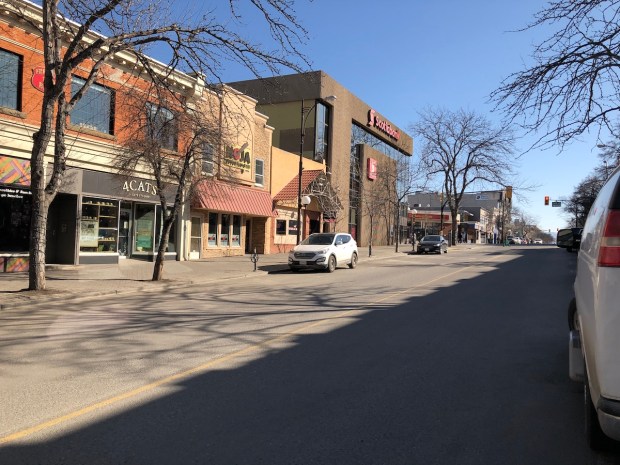
Victoria Street trying to weather COVID-19 at the height of the pandemic in 2020. (Image: Mel Rothenburger file photo)
By PETER TSIGARIS
Thompson Rivers University
This editorial is part of a book series I co-authored with senior undergraduate students, In the Shadow of the Hills: Socioeconomic Struggles in Kamloops, published by TRU Open Press. Chapter 8, authored by Olivia Simms, offers a rigorous analysis of income inequality in Kamloops using Lorenz curves and Gini coefficients.

Olivia Simms.
Drawing on 2019 and 2020 census data, she evaluates how government transfer payments, particularly pandemic programs like the Canada Emergency Response Benefit (CERB), the Canada Emergency Wage Subsidy (CEWS) and the Canada Recovery Benefit (CRB), helped soften the blow of job losses among lower-income workers.
The CERB and CRB provided direct payments to traditionally employed and self-employed Canadians to account for lost employment income, while the CEWS was provided to help businesses cover the wages of employees in the aftermath of shutdowns. What follows is my summary and reflection on Olivia’s work, highlighting key findings and their relevance for future economic policy.
How Government Transfers Narrowed the Income Gap in Kamloops
When the COVID-19 pandemic struck in early 2020, it disproportionately affected low-income workers. Across Canada, jobs in retail, hospitality, and personal services vanished almost overnight, while many salaried professionals were able to work remotely and maintain stable incomes. Kamloops was no exception. In fact, Olivia’s analysis shows that employment income, before taxes and transfer, inequality grew in 2020: the Gini index rose from 0.473 in 2019 to 0.492 in 2020, a 4% increase. A higher Gini means greater inequality.
Nevertheless, when one includes government transfer payments, the picture improves significantly. The Gini index for labour-market-related income (which includes these transfers) dropped from 0.492 to 0.440 in 2020. That’s a 12% reduction in inequality, suggesting that emergency support didn’t just help people stay afloat, it helped make income distribution in Kamloops more equal.
Let me explain the Gini index briefly. Imagine a perfectly equal society where every person earns the same income. On a graph plotting the cumulative share of the population (x-axis) against their share of total income (y-axis), this would appear as a straight diagonal line, the “line of equality.”
In such a world, the bottom 10% of earners would receive 10% of the income, the bottom 20% would receive 20%, and so on. The Gini index measures how far real-world income deviates from that ideal. A Gini of 0 means perfect equality. A Gini of 1 means total inequality, one person holds all income. A progressive tax system with strong social safety nets would reduce the Gini index. For example, Canada’ s Gini index according to World Bank was 0.317 in 2019 while the USA’s index was 0.417 in 2022 indicating that Canada has a more progressive tax system and social safety net.
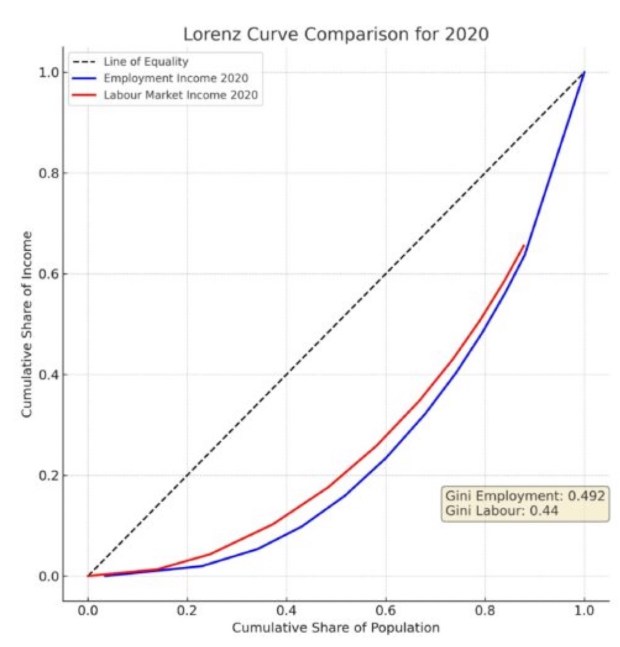
Figure 1: Lorenz curve employment and labour-market-related income comparisons for 2020. CC BY-NC-SA 4.0
The power of Olivia’s analysis lies in showing how targeted fiscal policy can change inequality. In 2020, nearly 20,000 working-age Kamloopsians received COVID-related income support as shown in Table 1.
Some critics might dismiss transfer payments as a short-term fix. While it’s true they were temporary, they highlight something important: inequality is not just the result of abstract market forces, it’s shaped and reshaped by external shocks and public policy responses.
If the pandemic taught us anything, it’s how interconnected we all are. When low-wage and frontline workers lost their jobs, the government stepped in, not just to help individuals, but to stabilize the entire economy. Inequality doesn’t only hurt the poor, it drags down growth, undermines opportunity, and weakens the resilience of our communities.

Figure 2: Government Transfer Payments, Kamloops, B.C., Statistics Canada 2023, Table from: Tsigaris et al. (2024)
Looking ahead, Olivia notes the need for more granular data, particularly at the top end of the income spectrum where extreme wealth is often underreported. But her chapter is a vital first step toward a better understanding of local inequality. For full details, see Chapter 8: Lorenz Curve Analysis for Income Inequality in Kamloops.
References
Tsigaris, P., Awad, A., Forbes, C., Izett, P., Kadaleevanam, U., Mehta, G., Noor, S., Simms, O., & Thomson A. (2024), In the Shadow of the Hills: Socioeconomic Struggles in Kamloops, TRU Open Press, https://shadowofthehills.pressbooks.tru.ca/
World Bank. (n.d.). Gini index (World Bank estimate). https://data.worldbank.org/indicator/SI.POV.GINI/

Government(s) arguably over-responded to Covid causing long-lasting deleterious effects in the economic environment of the nation(s)
LikeLike