
Kamloops’ fine particulate values above B.C. guidelines for 16 years
Editor’s note: This is an abbreviated version of a 20-page report entitled “Reconstructing the Historic Database of Annual PM2.5 Values for Kamloops, B.C. by Calculating the Offset between TEOM and BAM Measurements,” prepared by Dr. Peter Tsigaris, Professor of Economics, School of Business and Economics, Thompson Rivers University and Dr. Robert S. Schemenauer, Ph.D. (Atmospheric Physics) (Environment Canada, Retired) for Kamloops Physicians for a Healthy Environment Society (KPHES), July 25, 2014. Dr. Tsigaris has submitted this abbreviated version to The Armchair Mayor News.
Summary
For the 16-year period, 1998 to 2013, the city’s average value of PM2.5 is above the provincial guideline of 8 μg/m3 and well above the provincial goal of 6 μg/m3. The calculated average PM2.5 is 8.7 μg/m3 for the full period of record, i.e. much closer to 9 μg/m3.
Introduction
Has air quality deteriorated in Kamloops since 1998? One component of Kamloops air quality for which data are available is measurement of airborne particulate matter with aerodynamic diameters equal to or less than 2.5 micrometers, called PM2.5. Particulate matter is a complex air pollutant consisting of small solid particles and liquid droplets. These particles, often called aerosols, vary in size and chemical composition. They result from both natural sources and from human (anthropogenic) activities. It has been found that an increased concentration of airborne particulates, regardless of composition, causes increased incidence of disease and premature mortality. Many references can be found on the Kamloops Physicians for a Healthy Environment Society’s (KPHES) website (www.kphe.ca).
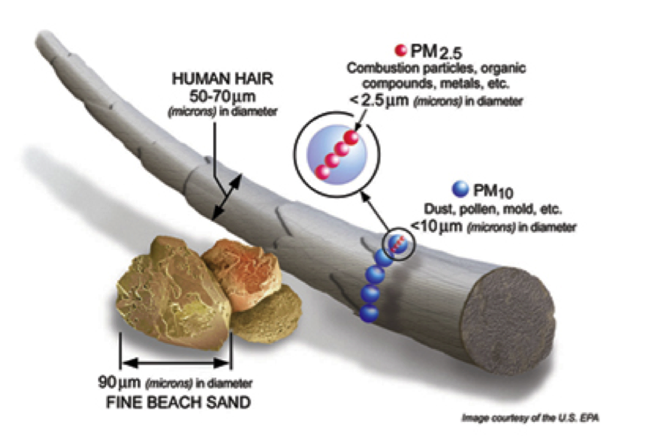
Figure 1: Image courtesy of U.S. EPA.
What the uncorrected Kamloops record looks like
Figure 2 shows the annual average PM2.5 in μg/m3, for the period from 1998 to 2010, measured in Brocklehurst (Kamloops) by the older TEOM (Tapered Element Oscillating Microbalance) instruments and from 2011 to 2013 measured at the Federal Building (Kamloops) by the more modern BAM (Beta Attenuation Mass) instruments. These are the currently reported data. The three recent years, 2011 to 2013, are discussed in detail by Tsigaris and Schemenauer (2014a). However, the data from the old TEOM instrument must be adjusted to correct for a bias in measuring the particulates in our air shed.

Figure 2: Annual average PM2.5 in Kamloops as reported at present.
Data from the B.C. Ministry of the Environment.
Figure 2 shows what would be a significant upward trend in PM2.5 over the 16 year period. It gives the impression that Kamloops air quality has been deteriorating, i.e. the concentrations of small particles in the air are rising. During the earlier years, air quality in Kamloops seemed to be meeting the B.C. provincial objective of 8 µg/m3 as an annual average. The air quality appeared to meet the provincial guidelines even in 2003, which was considered the worst year in Kamloops history, in terms of air quality, due to the August forest fire at Strawberry Hill. However, this graph indicates that 2013 had a significantly worse air quality than even 2003. Are the years 2011 and 2012, which are considered years when B.C. forest fire activity was low, really similar to 2003? Is this the real picture of the history of Kamloops air quality? Are we really getting worse?
How the complete historic record should look
In a recent 20-page scientific study prepared for KPHES, Tsigaris and Schemenauer (2014b) analyzed the full set of Kamloops data and showed that the TEOM severely underestimated the PM2.5 levels in Kamloops. In that report we used a comparison from a time when both instruments were operating in Kamloops to reconcile the measurements made with the older TEOM instrument to those presently being made with the BAM instrument. The BAM is acknowledged in Canada, the U.S.A. and in Europe as producing more accurate measurements of PM2.5. Adjustments to the TEOM data are being made world-wide and in that report we presented the first published calculations of the offset between the two instruments for the data collected in Kamloops.
Using various statistical methods we found an upward correction factor and adjusted the TEOM annual averages to conform to the BAM measurements. When this adjustment was made to the TEOM measurements in Kamloops one sees a completely different picture.
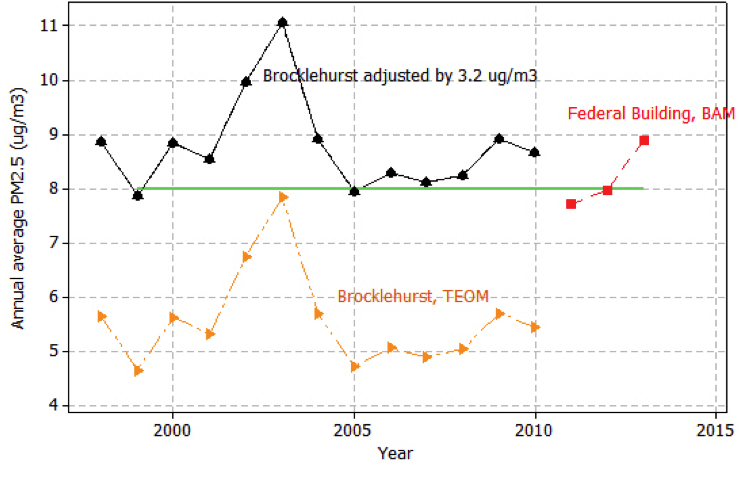
Figure 3: Annual average PM2.5 values for Kamloops, as reported and adjusted.
The city has had average annual values of PM2.5 that are at or above the provincial guideline of 8 μg/m3 since 1998. The 2003 annual average adjusted PM2.5 was approximately11 μg/m3. The adjusted annual average PM2.5 for the severe forest fire year of 2003 exceeded values for recent years in Kamloops and was well above the BC guideline of 8 μg/m3.
Conclusions
In conclusion, for the 16-year period, 1998 to 2013, the necessary adjustment to the historic PM2.5 data base for Kamloops is large and has major implications for both air shed management and the potential introduction of new heavy-industry into the city. Once corrected, the city’s long-term average concentration of PM2.5 is above the provincial guideline of 8 μg/m3. A calculated mean adjustment of 3.2 μg/m3 yields an estimated average PM2.5 of 8.7 μg/m3 over the period 1998-2013. Other more complex statistical methods yielded similar values. We can state, with 95% confidence, that the 16-year, long-term average PM2.5 in Kamloops is over the current British Columbia Ambient Air Quality Objective value of 8 μg/m3. It is well above the provincial goal of 6 μg/m3.
We should not add new sources of particulates to our air. The idea that there is room to add more pollution is a fiction. We should instead strive to make the air in Kamloops cleaner. The benefits of cleaner air are widespread and include a lower death rate and better health, as well as an economy that grows: through attracting new clean industry to provide employment opportunities; by appealing to people that would like to retire in a quiet and beautiful environment; by maintaining the status of being the tournament capital of Canada; and by appealing to tourists who wish to enjoy our beautiful landscape.
Dr. Peter Tsigaris and Dr. Robert Schemenauer
Kamloops, B.C.
References
Tsigaris, P. and R.S. Schemenauer, 2014a: Statistical Study of PM2.5 Measured at the Kamloops Federal Building for Years 2011, 2012 and 2013 ; Statistical Report for Kamloops Physicians for a Healthy Environment Society, 27 June 2014, pp 8. Accessible at: www.kphe.ca.
Tsigaris, P. and R.S. Schemenauer, 2014b: Reconstructing the Historic Database of Annual PM2.5 Values for Kamloops, B.C. by Calculating the Offset between TEOM and BAM Measurements; prepared for Kamloops Physicians for a Healthy Environment Society (KPHES), 25 July 2014, pp 20. Accessible at: www.kphe.ca.

Nice to see the addition of some genuine science to the often-uninformed debate. It puts to rest the charge that opponents are simply fear-mongering.
LikeLike
Click to access StateOfTheAir2014WebLR.pdf
Read this, Lyman. It also has interesting articles about diesel.
LikeLike
Earth Day 1970 ” We have met the enemy and he is us “, Earth Day , present day , Welcome to the Anthropocene on the blue dot . Thanks
LikeLike
While continuously working towards improving the air quality is a must, can we also have a comparison chart with other BC municipalities?
Very interesting to see the adjusted chart. Dr. T., what is your overall interpretation?
LikeLike
Sorry for the late response Lyman. We are working on a number of local and regional air quality projects including comparison charts with other cities like Kelowna and Prince George. With the old uncorrected data it was not possible to do this sort of analysis. Preliminary work seems to indicate that Kelowna is meeting the BC guidelines while we are approaching the higher Prince George levels for fine particulate matter.
We were under the false impression that our air quality was good when in fact it is not and has not been good. Yes improving air quality is a must. Studies indicate that the benefits from improving air quality far exceed the cost.
LikeLike